This information has been provided through the Threatened Species Recovery Hub National Environmental Science Programme – Project 1.1.2
Domestic cats are considered one of the most damaging invasive species worldwide, causing impacts from predation, disease transmission, hybridisation (with native wildcats, in Europe and Africa), and competition.
Globally, cats are considered to have contributed to the extinction of at least two reptile, 40 bird and 21 mammal species – over one quarter (26%) of the total extinctions of these groups since the year 1600.
Currently, cats are contributing to the imperilment of at least 360 threatened reptile, bird and mammal species worldwide, about half of which are species restricted to islands.
In Australia, at least 34 mammal species have become extinct since European settlement – a rate of mammal extinctions far greater than anywhere else in the world. Cats have been primary contributors to over two-thirds of these extinctions.
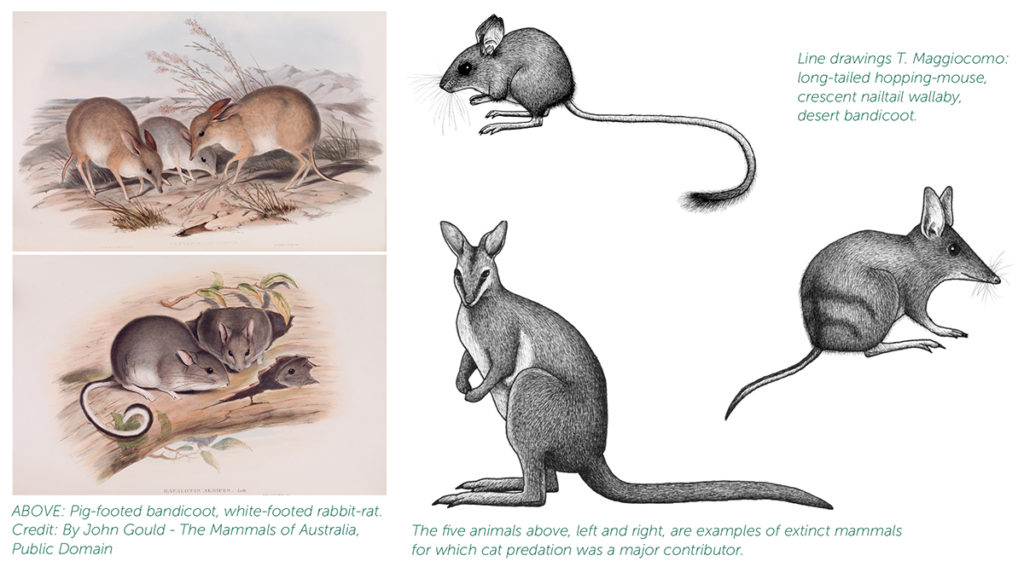
Examples include native marsupials like two species of pig-footed bandicoots, the lesser bilby, the Nullarbor dwarf bettong, the desert rat-kangaroo and the broad-faced potaroo; and native rodents including at least four species of hopping-mice, two species of rabbit-rat, and the lesser stick-nest rat.
Cats have also been primary agents in the extinction of some Australian birds that were restricted to islands, such as the Macquarie Island parakeet and Macquarie Island buff-banded rail.

Evidence of the impact of cats
There is extensive evidence of the impact of cats on Australian native species.
Many historical mammal extinctions corresponded to the spatial and temporal spread of cats across the continent.
Many native species (for example, the greater stick-nest rat and banded hare-wallaby) now persist only in areas that have remained cat-free (such as some islands, and more recently, fenced exclosures), and are unable to persist if cats are present.
There are also examples where species disappeared from islands after cats were introduced, but after the cats were eradicated, the same native mammal species have been successfully reintroduced to the islands (such as the western barred bandicoot and Shark Bay mouse to Faure Island in Shark Bay).
There have been many reintroduction attempts for threatened mammals on the mainland, and a key factor that determines whether an attempt is successful is whether cats are present or not.
Species that have become extinct, or whose populations have been most severely reduced, are (or were) mostly of the favoured prey size for cats, live (or lived) on the ground (rather than in trees), and that live (or lived) in areas of sparser vegetation (where it is harder to escape predators).

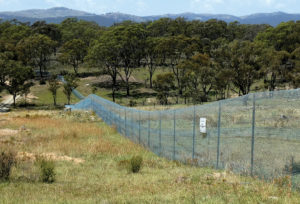
Fencing has been used successfully to exclude cats and foxes from small areas on the mainland, into which threatened mammals can be translocated. Photo: Wandiyali Restoration Trust
Many studies of the biology of Australian wildlife species have documented high rates of mortality from cats.
Many studies of the diet of cats have shown that they take large numbers of many wildlife species, including highly threatened birds, mammals and reptiles.
The historic and ongoing impacts of cats on Australian wildlife are far more severe than for wildlife on any other continent. This is probably because Australian animals have evolved without cat-like predators, many Australian animals have low rates of reproduction so their viability is readily compromised by an efficient predator (especially one with much higher reproductive rates), and because cats are so pervasive and such adaptable hunters.
How many Australian animals do cats kill?
How estimates are calculated
We have estimated the toll of cats on native (and introduced) animal species by: (i) collating all the local and regional cat diet studies carried out in Australia (about 100 studies, which examined about 10,000 cat diet samples, and with studies collected across a wide range of Australian environments); (ii) modelling and extrapolating from these to derive a spatial layer of the variation in numbers (and types) of animals killed per cat; and (iii) multiplying this by the (spatially variable) number of feral cats in Australia. From these analyses, we can determine the numbers of different types of animals killed by cats in different parts of Australia, and then sum these to derive national tallies.
This approach relies on some assumptions: for example, that the fraction of carrion (i.e. pre-killed animals) in the cat diet is small (which is reasonable, as cats much prefer to eat freshly-killed prey); and also that the numbers of animals killed by feral cats but not eaten is also small. Information on the diets of pet cats, and feral cats living in towns, is patchier than for feral cats in the bush.
Findings
Overall, feral cats in Australia eat about 2 billion reptiles, birds, frogs and mammals each year, and over a billion invertebrates. Mammals are the most commonly eaten of these prey items, for all types of cat (pets and ferals), with more than one billion mammals killed by cats in Australia every year. Pet cats that roam and hunt kill an additional 390 million mammals, birds and reptiles annually.
Most of the animals killed are native species. The percentage of native animals in the diet depends on whether the cat lives in the bush or in towns, and the type of animal prey.
For example, nearly all of the reptiles and birds killed by feral cats in the bush are native species, whilst most mammals killed by pet cats in towns are introduced species.
This annual toll translates to 1.9 million reptiles, 1.2 million birds, 3.2 million mammals, 3 million invertebrates and at least 0.25 million frogs killed every day in Australia by cats.
Most of this toll is caused by feral cats living in the bush (68%), but feral cats in towns, and pet cats, also kill large numbers of animals.

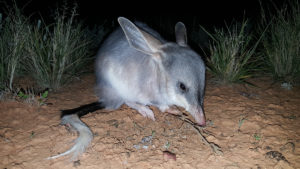
Cats prey on greater bilbies. Photo: Alexandra Ross
The number of vertebrate animals killed per cat is highest for feral cats in the bush, at 791 animals every year.
Feral cats in towns kill fewer vertebrate animals per capita (449 animals per cat per year) because intentionally or otherwise humans also provide them with some food. Individual pet cats kill fewer still, at 186 animals per cat per year. However, because feral cats in towns and pet cats live at higher densities than feral cats in the bush, their kill rates per square km are actually much higher.
Cats also kill introduced birds and mammals, especially rabbits and house mice (in southern Australia), however cats rarely control populations of these introduced pests. High densities of rabbits and introduced rodents also allow cats to reach high densities, which means that even if those cats take only a small proportion of native animal species in their diet, the toll on native species will still be high.
Cats will also switch prey types, so if management or weather conditions lead to rapid decline in numbers of rabbits and introduced rodents, large numbers of cats will then switch to consume mostly native animal species.
Table 1: Summary of the population sizes of cats and their average predation rates on invertebrates, reptiles, frogs, birds and mammals, across Australia.
|
Feral cats in bush |
Feral cats in towns (heavily modified environments) |
Pet cats that roam and hunt |
| Overall population size |
2.1 million |
0.7 million |
2.1 million |
| Area in which this type of cat lives |
7.63 million km2 |
57,000 km2 |
29,683 to 54,201 km2 |
| Overall take of invertebrates per year |
769 million |
317.3 million |
No estimate available |
| Average number of invertebrates killed per cat per year |
371 |
453 |
No estimate available |
| Average number of invertebrates killed per km2 per year |
101 invertebrates/km2/year |
5567 invertebrates (rounding up) |
No estimate available |
| Overall take of reptiles per year |
466 million
(>99% native species) |
130 million |
83 million
(100% native) |
| Average number of reptiles killed per cat per year |
225 |
180 |
40 |
| Average number of reptiles killed per km2 per year |
61 reptiles/km2/yr |
2280 reptiles/km2/yr |
1530–2790 reptiles/ km2/yr |
| Overall take of frogs per year |
92 million |
No estimate available |
At least 1.01 million |
| Average number of frogs killed per cat per year |
44 |
No estimate available |
0.5 |
| Average number of frogs killed per km2 per year |
12 frogs/km2/year |
No estimate available |
19–34 frogs/km2/year |
| Overall take of birds per year |
272 million
(99% native species) |
44 million |
118 million,
(68% native) |
| Average number of birds killed per cat per year |
129 |
62 |
56 |
| Average number of birds killed per km2 per year |
36 birds/km2/year |
772 birds/km2/year |
2170-3960 birds/km2/yr |
| Overall take of mammals per year |
815 million (56% native species, but highly variable) |
149 million |
189 million,
(35% native) |
| Average number of mammals eaten per cat per year |
393 |
207 |
90 |
| Average number of mammals per km2 per year |
107 mammals/km2/yr |
2610 mammals/ km2/yr |
3490–6370 mammals/ km2/yr |
| Overall take of all vertebrate animals |
1645 million
(78% native species) |
323 million |
391 million,
(62% native) |
| Average number of vertebrate animals killed
per cat per year |
791 |
449 |
186 |
The patterns of cat tolls on native wildlife varies between groups and habitat types.
Invertebrates
- Cats eat a large number of invertebrates, although these form a relatively small proportion of their diet by mass. Cats may pose a threat to some large-bodied, range-restricted invertebrate
- The favoured invertebrate groups of feral cats in Australia are grasshoppers, beetles and butterflies
Reptiles
- There are records of cats eating about one quarter of all Australian reptile species, including 11 species listed as nationally
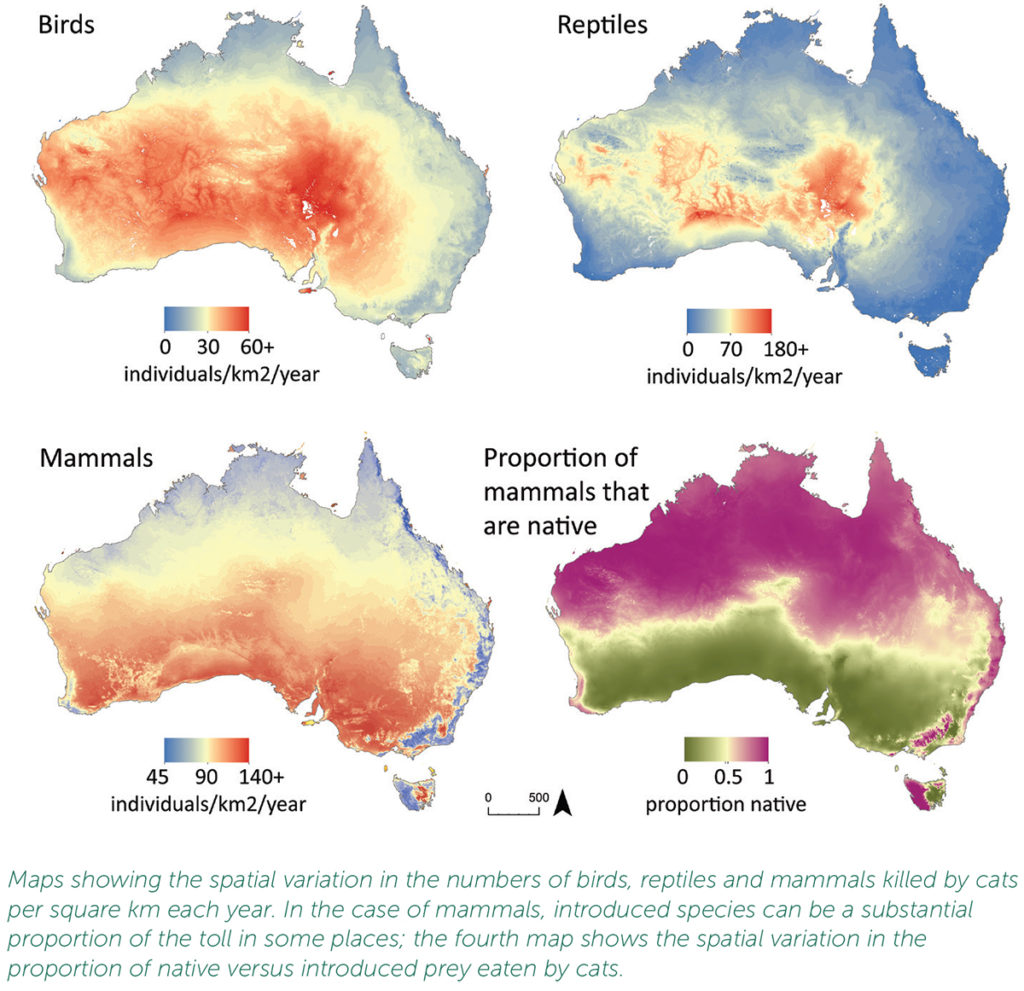
- The toll of reptiles is greatest in arid areas of
Frogs
- There are records of cats eating 30 native frog species in
- Further research is required to clarify the conservation significance of cat predation on frog populations in
Birds
- There are records of cats eating almost half of all Australian bird species, including 71 species listed as threatened at national or global
- The toll of birds is greatest on islands, and in arid areas of
- For birds, the likelihood of being killed by a cat is highest if it lives on an island, if it is in the size range 60-300g, and if it nests and/or forages on the ground

Mammals
- There are records of cats eating over half of Australian mammal species, including 50 species listed as threatened at national or global
- The overall toll of mammals is greatest in areas with lower temperatures, in non-rocky habitats, and on the mainland and large islands (rather than small islands).
- However, the toll of native mammals is highest in northern Australia and wetter parts of eastern Australia, and lowest in southern and dry parts of Australia; the toll of introduced species (e.g. rabbits, house mice) is geographically
- The likelihood of being killed by a cat is highest for native mammals that aren’t bats, live in low rainfall areas, non-rocky areas, and/or are of intermediate size (35-5500 g, peaking around 400 g), such as mulgaras, stick-nest rats, and barred

The number of species preyed on by cats will be much greater than the available diet studies suggest. For example, some species have not been reported as eaten by cats because these species have small distributions and it is less likely that a cat diet study has taken place within that distribution.


